Phone for a no-obligation chat now: 01299 382 957
DATA INSIGHTS ‘EMPOWER’ USERS IN 2021
Microsoft are making continuous improvements to MS Dynamics 365, with the key aim to ‘empower’ individuals, teams and organisations in 2021. In the new release Wave 2 Power BI has taken another step-up, so your dashboards will give even better insights, empowering everyone in your organisation.
Now let’s take a look at how Power BI has been further enhanced for 2021:
Empower Every Individual
Power BI takes advantage of the advancements Microsoft has made in AI to help users find patterns in vast amounts of data. Insights are available to everyone in the organisation, wherever they are and in context, from your applications, websites, and portals. Power BI dashboards will empower individuals across your business to drive and grow the data culture.
Empower Every Team
Insights become more valuable as they’re shared, and by integrating Power BI deeply with Office 365 (which includes Microsoft Teams, Excel, PowerPoint, etc.), Microsoft brings insights to where everyone works and collaborates. Teams will also continue to mature, deepening the integration in channels, chats, and notifications. See our Teams for your team blog with Microsoft videos that show real insights of the capabilities.
Feedback from customers has suggested that they value the ability to move between insight to action to automation, so they can adapt quickly to changing business requirements. Power BI, Power Apps, and Power Automate natively to work together to achieve this.
Empower Every Organization
IT departments within enterprise companies will gain full visibility and control with centralized administration, governance, and industry-leading security capabilities. Power BI Premium provides unmatched abilities so customers aren’t forced to integrate multiple products that could lead to disjointed data experiences.
Check out how easy it is to set-up your dashboard
The Microsoft power bi tutorial for beginners gives you easy set up tips.
How can I get the insights I need?
We are now going to drill down into just one aspect of Power BI with visuals so you can get to grips with the possibilities it brings forth.
Wouldn’t it be amazing if you could use natural language? For example, “what were total sales last year?” Well now you can!
Data sets made in Power BI for your different teams, like your Sales or Administration teams, can be further manipulated by clicking ‘Q&A’ on the Power BI dashboard and simply asking a question.
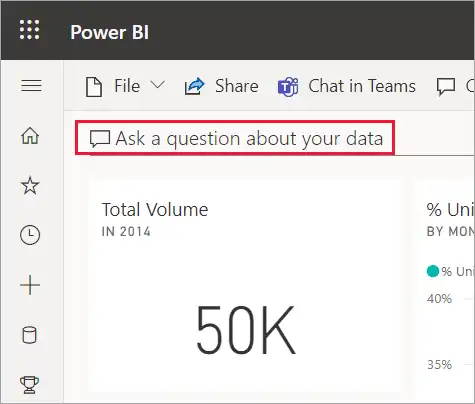
Type a question in natural language
Type a question in the ‘Q&A’ box on your Power BI dashboard, to gain near instant insights into your data.
Suggestions to help you form your question can also be seen when the box is clicked into, with phrases and complete questions previously made by the creator of the dataset – who would have the insight to know what operators might need.
You can then choose one of these questions as a starting point and continue to refine the question to find a specific answer. Or use a table name to help you word a new question. See image below:
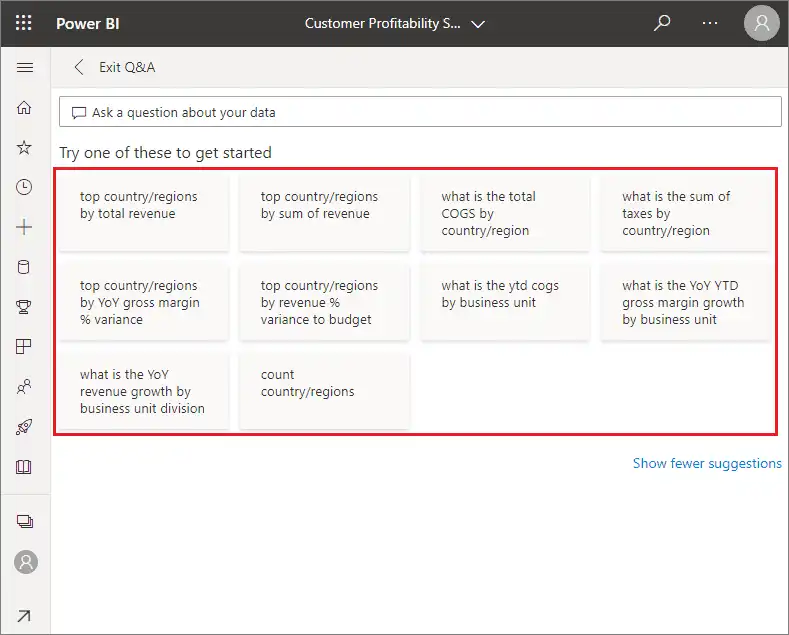
Pre-loaded answers help operators
You can then choose one of these questions as a starting point.
As you type a question, Q&A picks the best visualization to display your answer. The visualization changes dynamically as you modify the question.

Searching using Microsoft's Q & A
The question here was: “how many stores”, with the answer shown in the bottom right corner – ‘Count of store 104’.
When you type a question, Power BI looks for the best answer using any dataset that has a tile on that dashboard. If all the tiles are from datasetA, then your answer will come from datasetA. If there are tiles from datasetA and datasetB, then Q&A searches for the best answer from those 2 datasets.
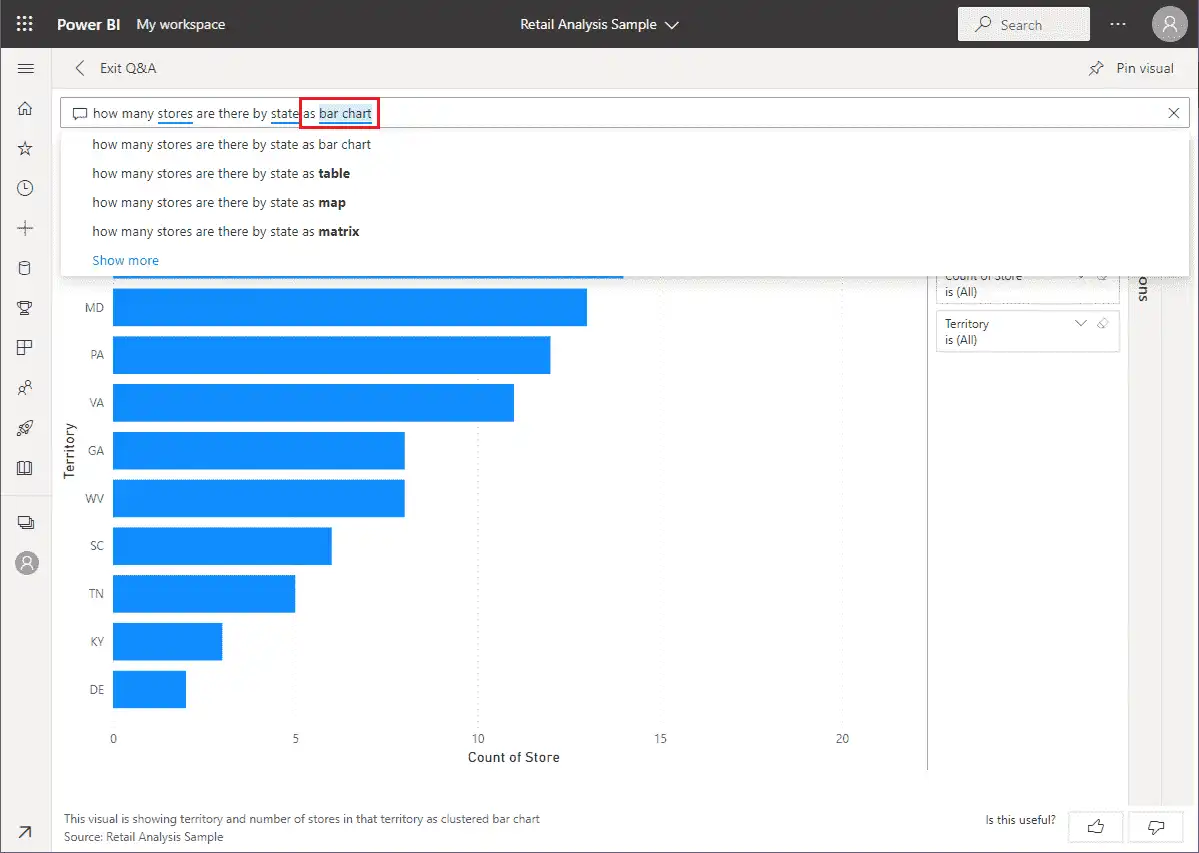
Answers appears near instantaneously
The question here was: “how many stores by state bar chart” so the data is shown, near instantaneously as a bar chart.
The answer to your question is displayed as an interactive visualization, and updates as you modify the question. In the screenshot below, the data is drilled down further and shown as a map.
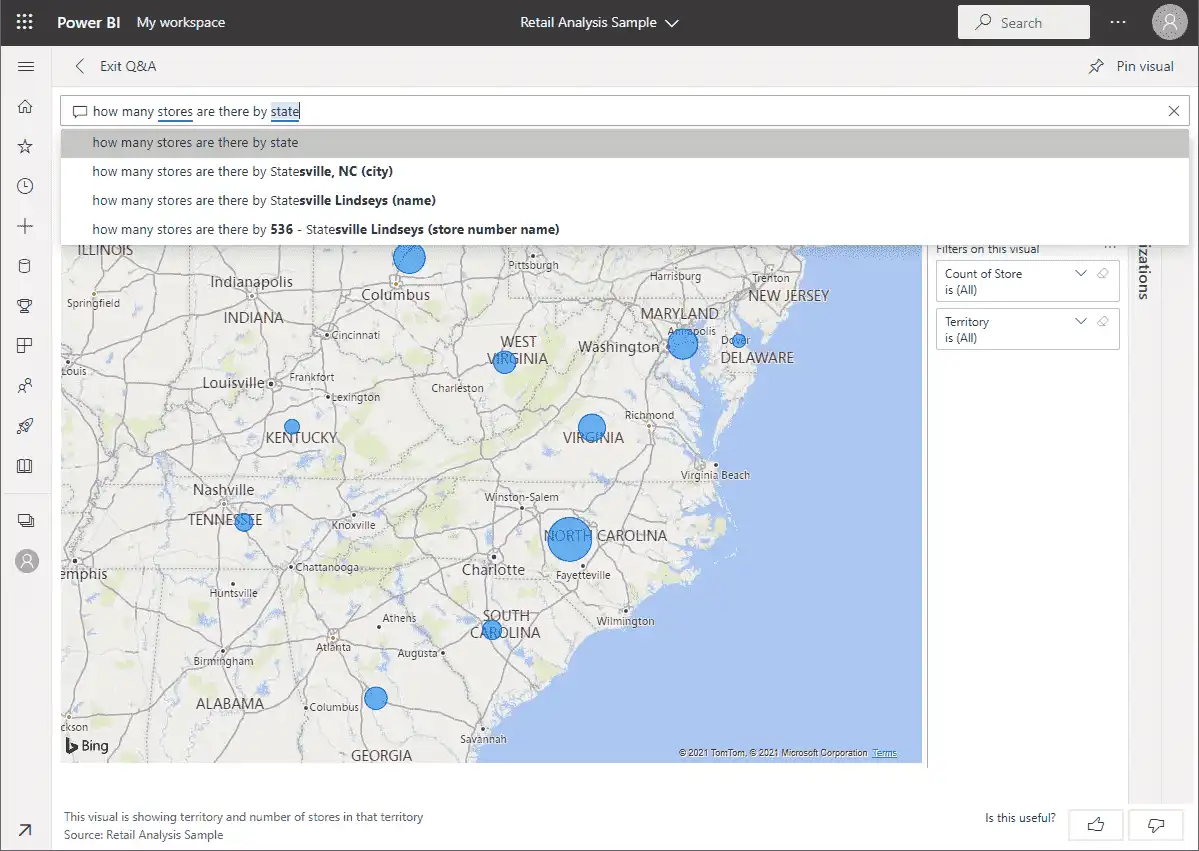
Map of data in MS power BI dashboard
The question here was: “how many stores by state” which is in maps, so the dropdown shows the States included like Statesville NY (city).
SHARE POST
TECHNOLOGY CAN RULE YOU OR BE YOUR TOOL
Find out more about your digital CRM solution today.
For further information book a call
Or call us now