At the managerial level, you will gain a holistic view of all product category sales and can drill-down to analyze profit margins.
BETTER BUSINESS INTELLIGENCE VIEWED ON ONE DASHBOARD
In a data-driven culture, decisions are based on facts but often these facts can come across your desk as reports, spreadsheets, emails with charts, and even printed handouts. It is easy to lose track and worry that you do not have the most up-to-date information.
By making insights and analytics tools accessible to everyone in your organization you can break down silos and visualize to discover what’s important.

Power BI is a collection of software services, apps, and connectors that work together to turn your unrelated sources of data into coherent, visually immersive, and interactive insights.

Power BI full dashboard view
Charts are used to give clarity on each aspect of data, which can then be used to drill-down further for insights. The data included here is an example of how it can be used for HR, Recruitment, etc.
It will empower your team and get you on the same page, as documentation is updated in real-time, so you see the freshest content. Remote working colleagues, field-based operatives, and offshore teams can work across all media devices to collaborate easily on projects.
Your data may be an Excel spreadsheet or a collection of cloud-based and on-premises hybrid data warehouses but with a Power BI dashboard, you can filter slice, and export data creating real-time reports.
ROI
When you migrate to Dynamics 365, it will take you from hypothesis to validation in minutes, so ROI is guaranteed. Using predictive models and advanced analytics will optimise your business processes and help find new opportunities.
Get analytics tools that scale according to your business needs.
Pay or cancel Licenses on a monthly basis.
Reduce hardware and infrastructure costs by migrating to the cloud.
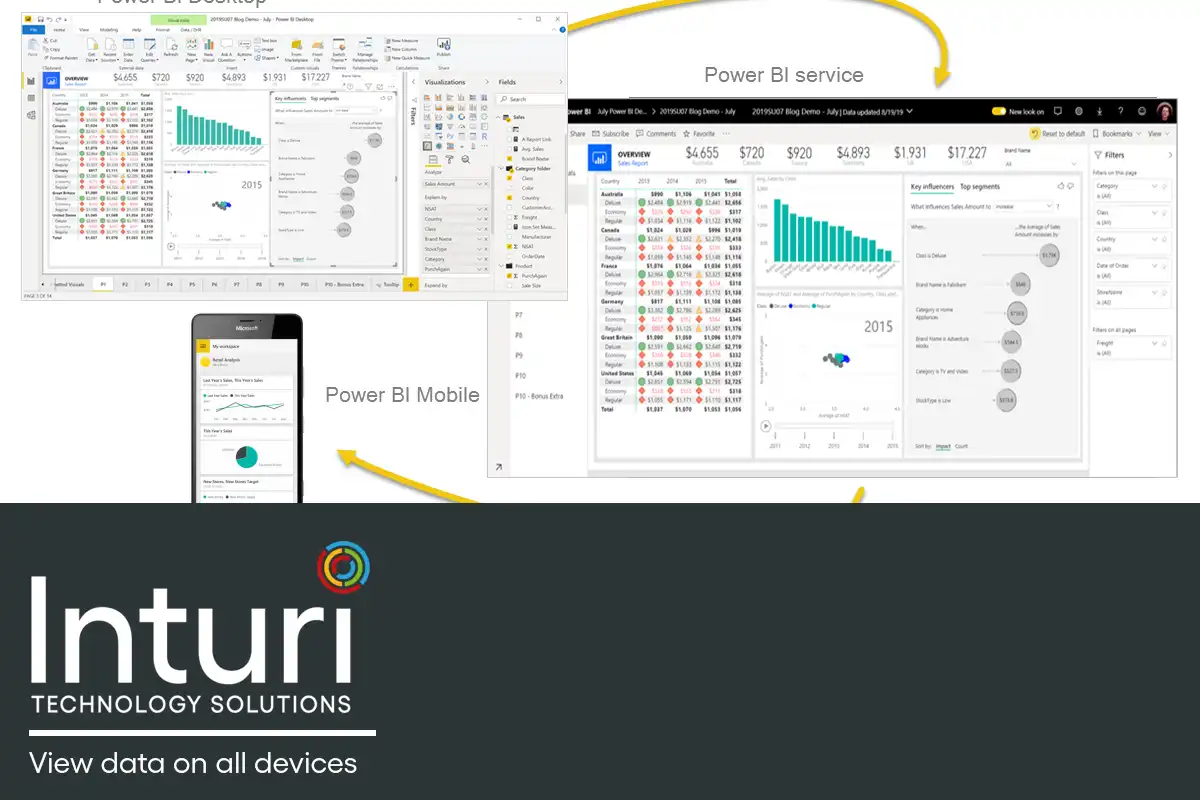
Power BI
Data can be viewed across all media devices.
COMPONENT PARTS OF POWER BI
Here are the three basic parts of Power BI.
The Power BI desktop. This is a windows desktop application that many people will already be familiar with, making the transition for users straightforward.
Power BI service. Put simply, this is the software, SaaS (Software as a service).
Power BI mobile apps. These enable you to access files and your dashboard remotely via Android, iOS or Windows.
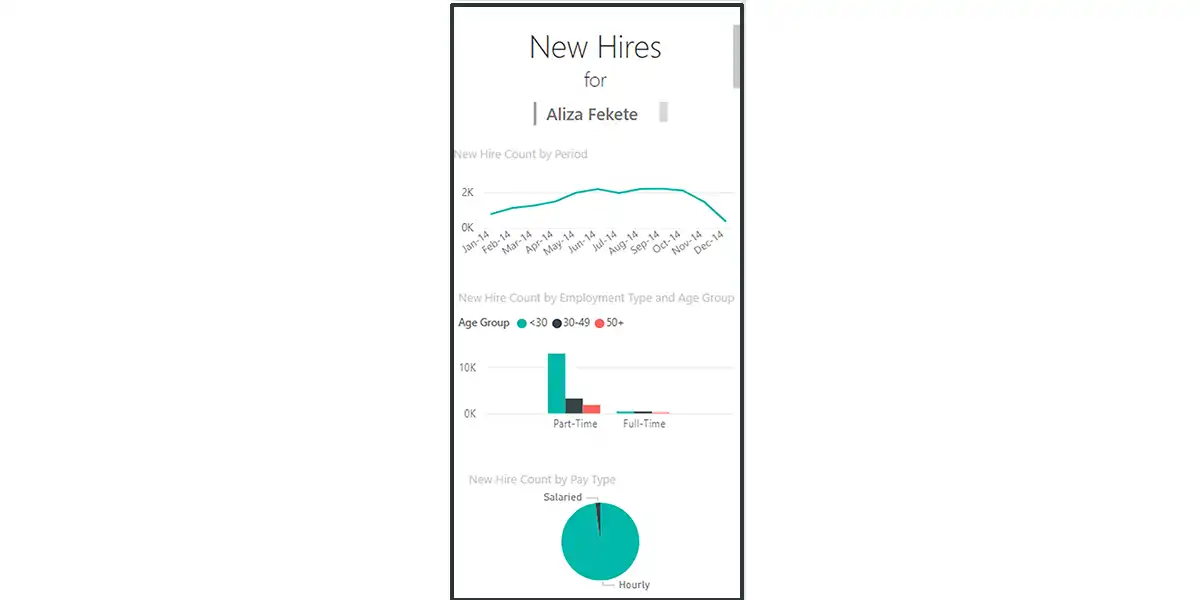
Power BI dashboard, as seen on a mobile phone screen
The data included here is an example of how it can be used for Recruitment, and the page represents New hires. Access is granted to Aliza Fekete, in this case, but would be regulated by role-based permissions.
View data from source
A Power BI dashboard is a single page, often called a canvas, that uses visualizations to tell a story. A well-designed dashboard contains only the most-important elements of that story, which is created by drag and drop, by the people closest to your business, your employees.
Data can also be pushed and pulled from legacy platforms and external sector-specific web platforms eg. For logistics – Freight logistics platforms.
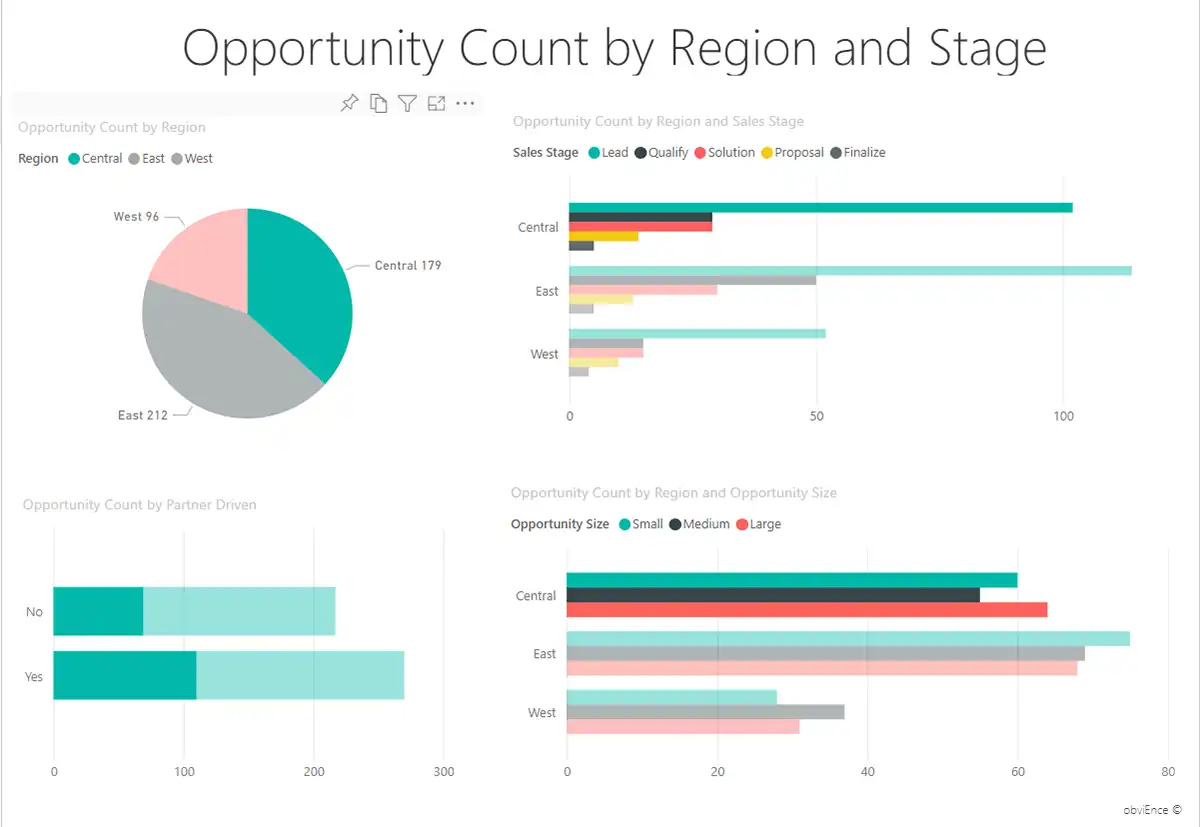
The input of data
The input of data to a Power BI dashboard can be from any data source, including Azure cloud, external websites, Excel, Mailchimp, etc. On this recruitment dashboard we can see region, and the stage the recruitment is at.
WILL POWER BI FIT MY ROLE?
Different members of your team will inevitably want different things from their Power BI dashboard, and you might want different things at different times depending on what you are trying to achieve. Here is a simplistic overview:
- Power BI for Business users – will enable you to view reports and dashboards.
- Power BI Desktop for Report creators
- Power BI Report Builder for Enterprise report creators
- Power BI for Administrators
- Power BI for Developers
All aspects of Power BI are available, which is how it can be so flexible. So for example: Daily you might be using Power Bi service to view reports and dashboards, but perhaps once a month you’ll use Power BI report builder to create reports. A sales agent might well in the Power BI phone app to drill into new sales lead details and monitor progress on quotas.

Data represented as a bar line
Power BI dashboard with data represented as a bar line. This is a sample created for a Logistics operation.
ENTERPRISE LEVEL REPORTING
Generate reports that make it easier for more people in your organisation to understand and work directly with data. By building a holistic view of customers you can tailor interactions at scale using contextual insights and anticipate customer needs.
By unifying data silos Dynamics 365 builds a single end-to-end analytics platform you will gain a global view with enterprise-level reporting.
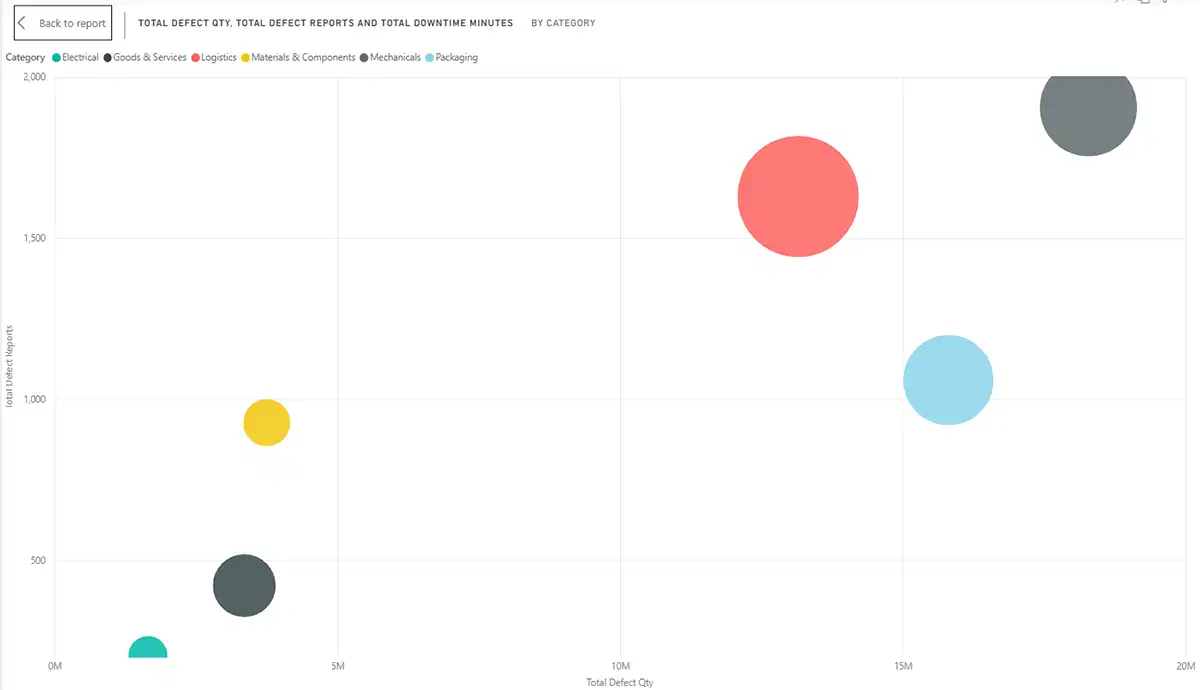
Chart options to suit how you want to see your data
A bubble chart can be used as an element with a full Power BI dashboard. This chart was created for a Reseller and represents Supplier quality analysis.
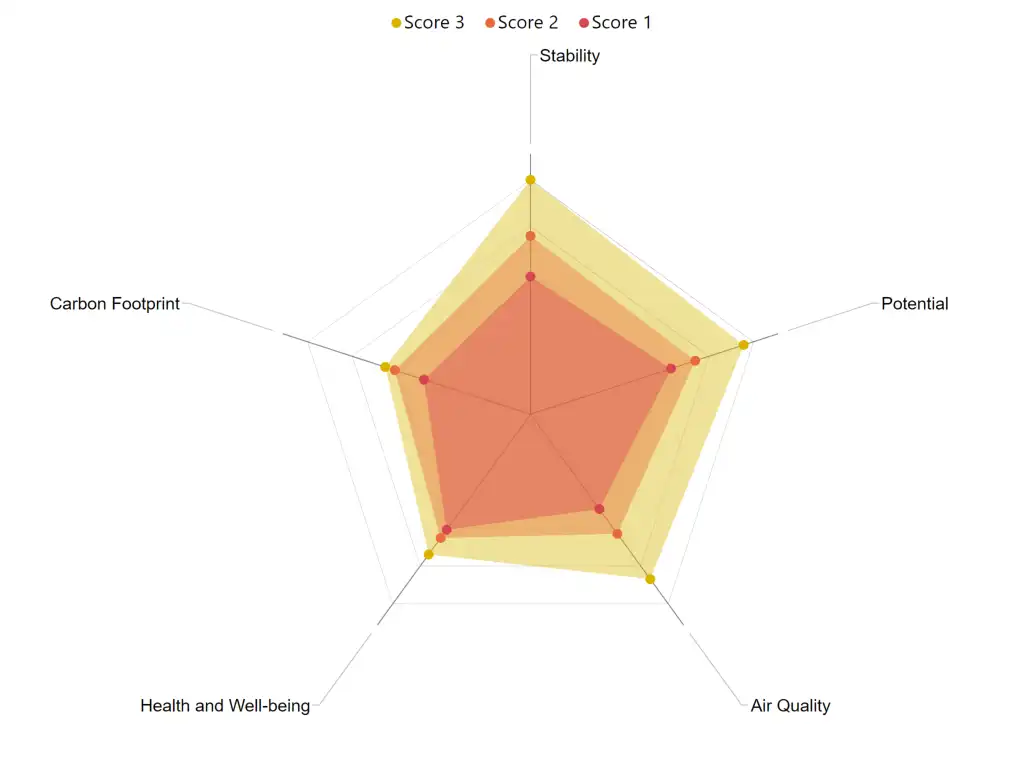
Chart to represent well-being
A spider/radar chart can be used as an element with a full Power BI dashboard. This chart was created for HR to identify well-being in a factory floor environment.
Secure reporting
Consolidate data governance with role-based permissions, while still supporting personalised, custom dashboards.
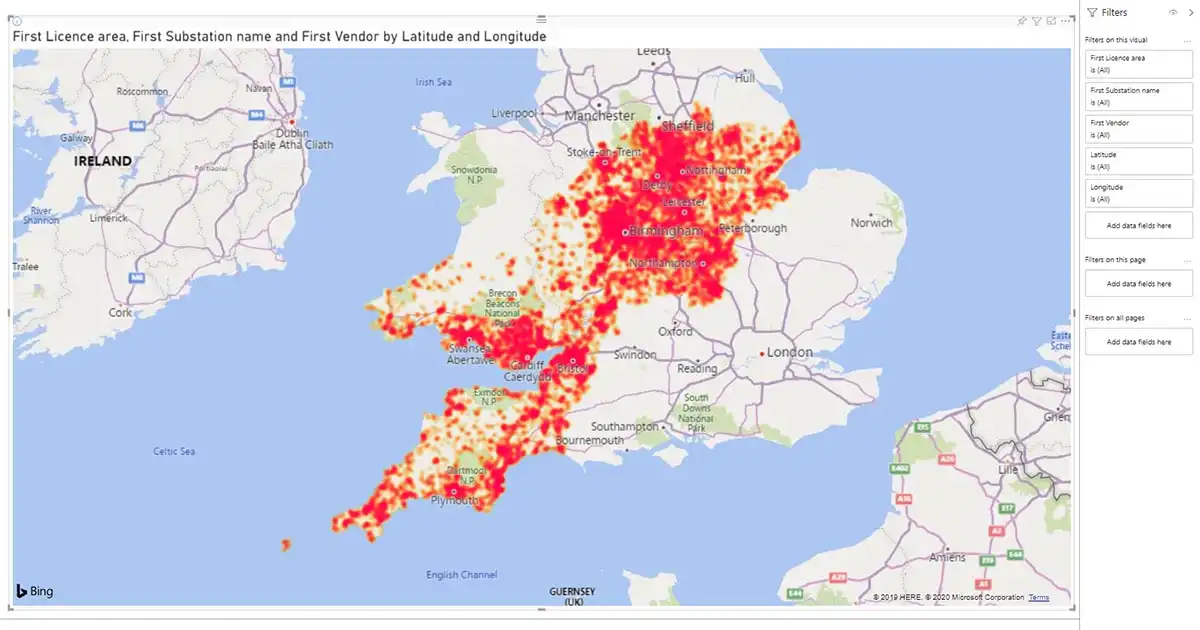
Power BI dashboard, 360-degree view on one dashboard
Power BI dashboard, full-page statistics displaying Electric vehicle charging points and usage, for a Mobility as a service company.
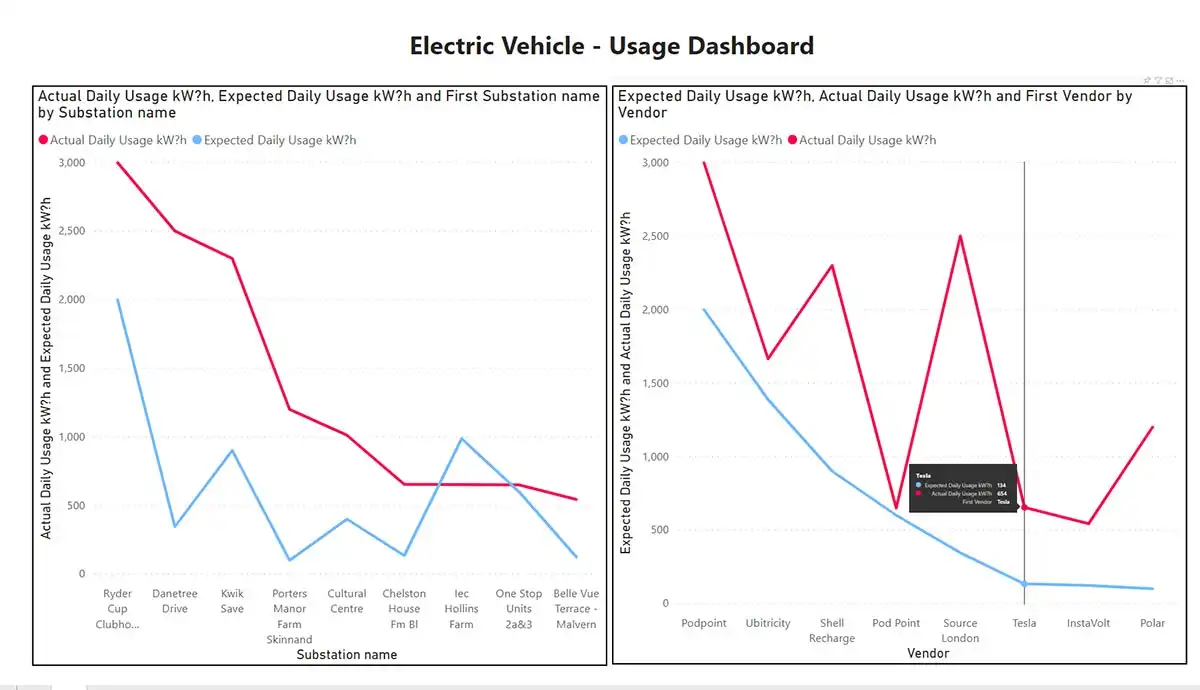
Power BI dashboard, vendor statistics graph
Power BI dashboard, vendor statistics graph displaying Electric vehicle charging usage, for a Mobility as a service company.
INTELLIGENT REPORTING
Working alongside your Inturi consultant will highlight the areas of your reporting that can be automated. Power Automate once instigated, runs in the background, so you uncover even more insights and relieve your staff of repetitive, low value and error-prone tasks.
SMB’s should not dismiss this option though, as the Azure License is based on consumption, so you will not be paying enterprise-level prices.
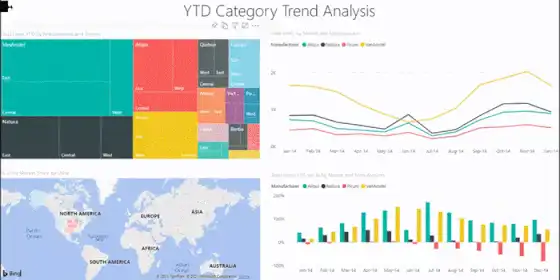
Full Power BI dashboard
Full Power BI dashboard, with data being pulled to create different visuals. This is an example of how it can be used for logistics.
HOW EASY IS POWER BI TO USE?
Power BI is a good place to segregate and explore data as it’s you can’t break anything. However, changes to your set-up view can be saved, but those changes will only affect your content. You can also Favorite a view.
When interacting with reports in the Power BI you can be in Editing view and Reading view. The Editing view is used by report creators, who then share them with others, but the major thing to note is that even in the Reading view, the content isn’t static. Looking for trends, insights, and other business intelligence is simplified, and alerts can be set for time periods or as data updates.
Power BI dashboard can be viewed across all media devices
Data is kept secure by role-based permissions, but can be viewed remotely on any media device eg. Phone, tablet, and Interactive white boards, etc.
If you have any questions please do not hesitate to give us a call.
The predominant feedback from our clients about Dynamics 365 and the Power BI dashboards is the ‘ease of use’. They are all impressed by how instinctual their dashboards are. It’s worth checking out our Case Studies to see customer feedback quotes.
Also check out Microsoft’s latest advances in Power BI from Wave 2 released October 2021 – in this blog we explore ‘natural language’ which will enable you to ‘Search’ your CRM’s data, as easily as you would search for content on a search engine.
SHARE POST
TECHNOLOGY CAN RULE YOU OR BE YOUR TOOL
Find out more about your digital CRM solution today.
For further information book a call
Or call us now